With the “recovery shape” guessing game firmly in the rearview (happy to say goodbye to whether “K-shaped” should join ranks of “V-” and “L-shaped” in the economist vernacular), the YTD period is evidence of the difficulty in pricing future outcomes at this particular market juncture. Companies lifting the hood to their recent quarter’s results are doing so at a time when the year-ago snapshot captures one of the most precipitous drops in public markets history. Trying to level-set our true run-rate, while simultaneously deciphering what’s next for equity investors, seems to be an effort stuck in “work-in-progress” mode. As we head into the holiday weekend, we saw the opportunity to offer some food for thought to accompany that which is earmarked for the grill or cooler, all in the effort to help illuminate our path forward as equity investors.

First, we find it a helpful exercise to plot the “You Are Here” point on the economic recovery map, especially as our collective neck pain heals from the 2020 whipsaw. Figure 1 below triangulates economic output (via GDP) and the labor backdrop (via unemployment). The seemingly unanswerable question—the one the market faced while staring down the barrel of what turned into a -31% YoY GDP plummet (a sequential figure that’s annualized)—was the ultimate impairment magnitude from global sheltering. The end result to a sequence of annualized quarterly outcomes of -5%/-31%/+33%/+4% across 1Q/2Q/3Q/4Q of 2020: a 2.3% impairment to the full year. In other words, 2020 saw $497 billion of output extracted from 2019’s GDP base of $21.4 trillion. Meanwhile, we’ve managed our steady rehabilitation from the worst jobs print in modern history and are marching our way back towards the Fed’s “natural” unemployment threshold.
Figure 1: The Other Side of the Whipsaw
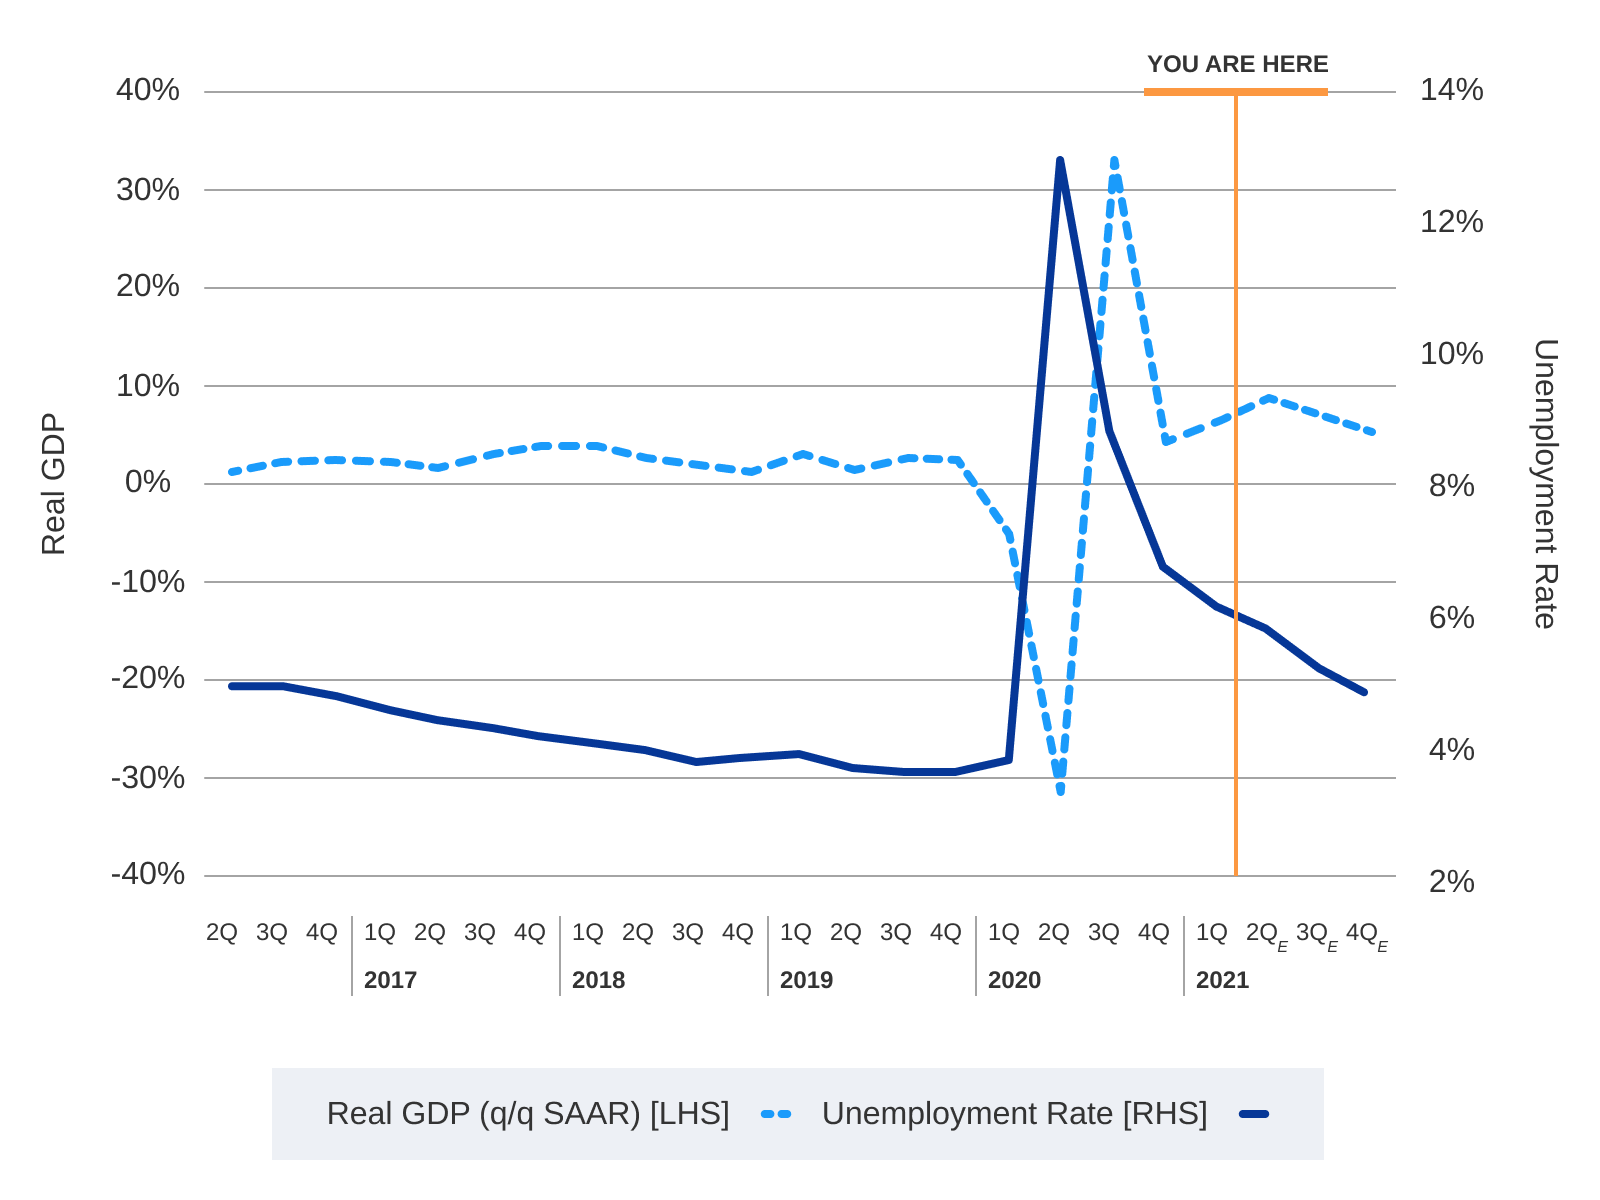
Source: FactSet, US Bureau of Economic Analysis
All of this of course was a net outcome. The offsets were a series of massive government stimulus efforts across PPP business loans, direct-deposited stimulus checks, unemployment benefit extensions, federal student loan payment freezes, and Federal Reserve balance sheet expansion. In aggregate, the US funneled $5.3 trillion into the system across these various sources, undoubtedly helping to mitigate the economic crater’s size. As consumer demand DoorDashed its way to online fulfillment channels, bank savings accounts were beneficiaries of the direct stimulus. In particular, the personal saving rate reached uncharted levels for the US consumer, putting us closer (albeit temporarily) to higher-savings rate nations, like China (see Figure 2 below).
Figure 2: US Consumer on Solid Footing
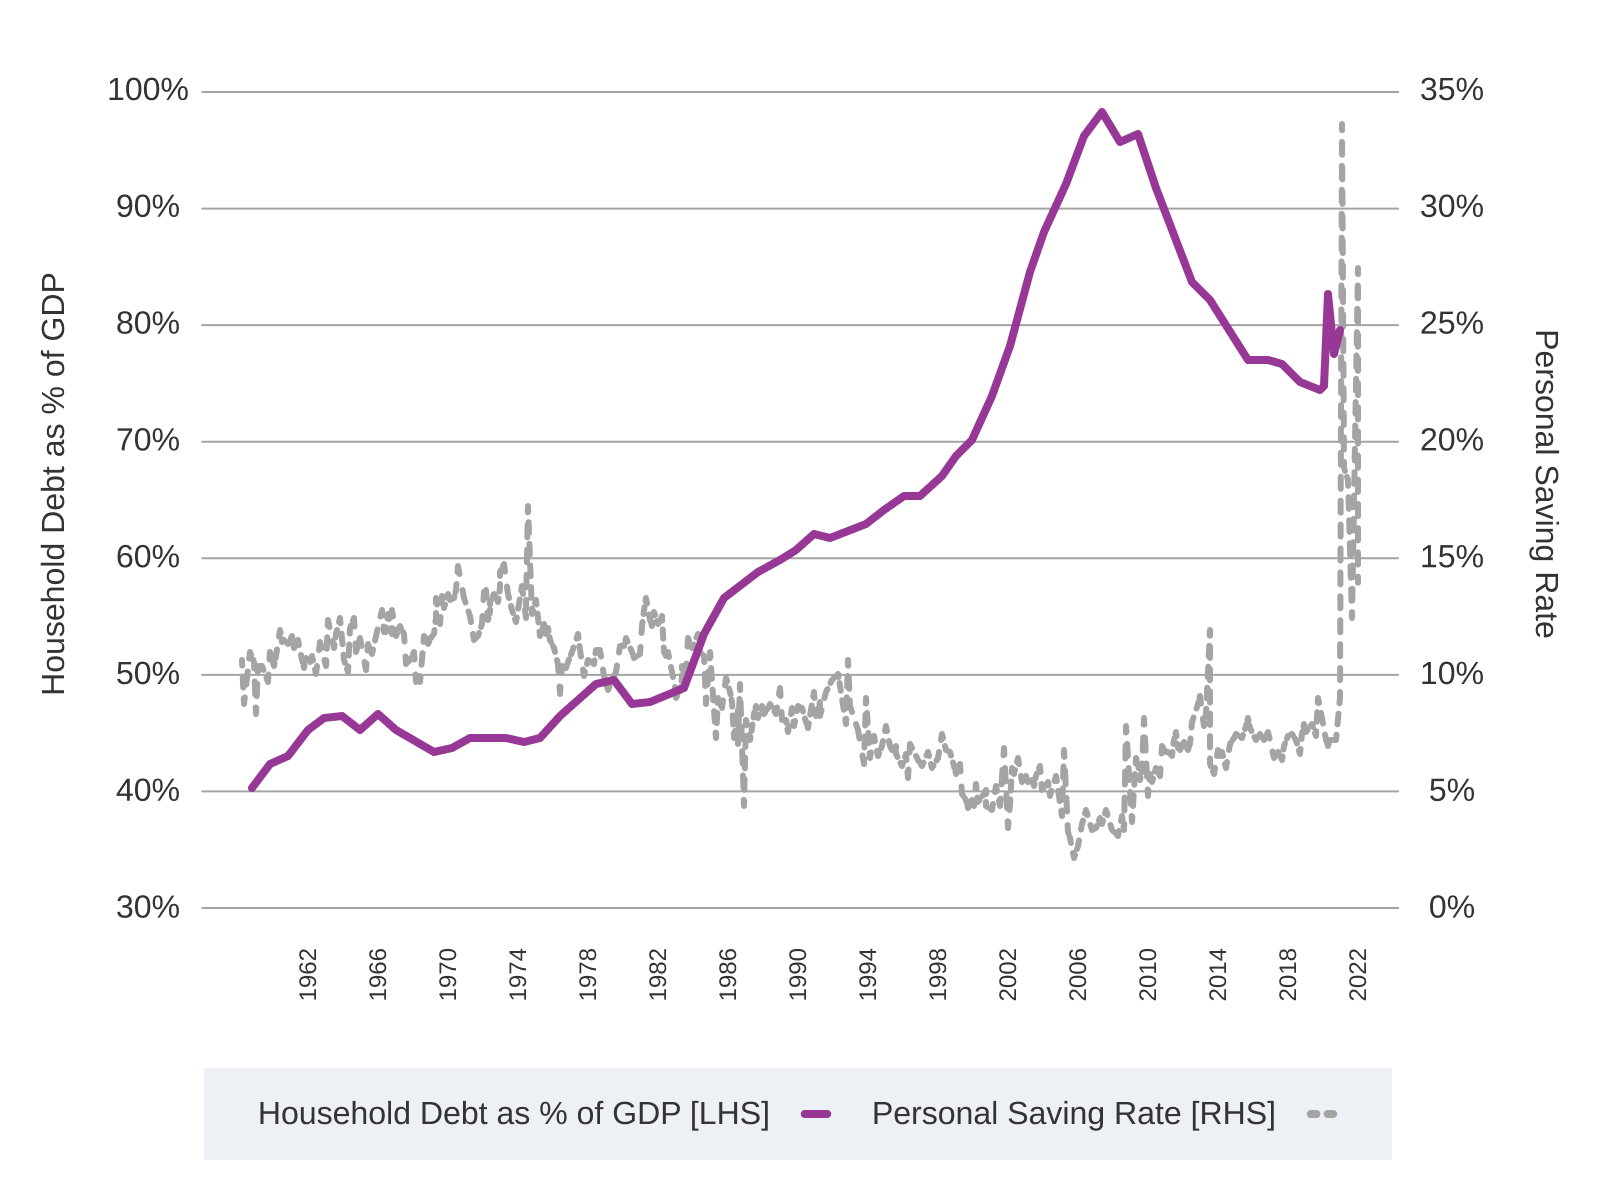
Source: FactSet, Federal Reserve System
When layering in the state of the consumer balance sheet (via the purple line in figure 2 above), we see a recent uptick in overall household debt compared to 2019 levels. The good news, we’re a far cry from the lofty 1:1 debt-to-GDP ratio that we approached during the systemically over-extended period of the financial crisis. With the consumer on far more solid footing, an improving jobs backdrop, and healthy savings assisted by stimulus (and possibly lower travel and entertainment outlays), we see a silver lining to pent-up demand heading into the back half of 2021.
When we stop to observe YTD equity market pricing outcomes, it’s important to consider the dynamics behind the calendar year snapshot. The S&P 500 sits at +12.4%, with the style counterparts +6.1% for growth and +17.9% for value (via respective Russell 1000 proxies). To some degree, 2021 has acted as a partial gap-closer to the prior year. The digital deluge of 2020 disproportionately benefited the balance-sheet lite business models in growth more so than value. Growth constituents capped off last year with a +38.5% total return, while value edged out +2.8%. This 36-point spread has ceded a 12-point give-back thus far in 2021 and speaks to composition differences across the equity opportunity sets.
As public equity investors, we’re conditioned to expect more noise and to heighten our awareness for over-levered pockets that could be the cause of future portfolio contagion. Focus areas in this exercise today are undoubtedly inflation, government spending, SPAC issuance, ESG packaging, and cryptocurrencies, to name a few. Weighing all current evidence on the scale, we see a continued ability to navigate a path for mindful risk allocation as equity investors. It just requires even more careful stock-picking through the current global recovery backdrop.