In recent days the media has reported stories-and created investor panic-as economic indicators suggest the world economy is close to another recession. Their basis for this is that history repeats itself as indicated by the yield curve, thus becoming fodder for “if it bleeds it leads” coverage in the investment media. As is typical with much of this type of “reporting,” the headlines rarely provide an adequate, to put it mildly, representation of the content of the article.
The Business Insider piece is one of those articles whose headline cautions for impending doom, whereas supporting commentary unveils many caveats to that outcome.
A couple of things to keep in mind on the US Treasury yield curve: The Fed can only control the short end. Market forces of supply/demand control the outer years, and one period’s effects on the more extended durations can be significantly different than prior periods.
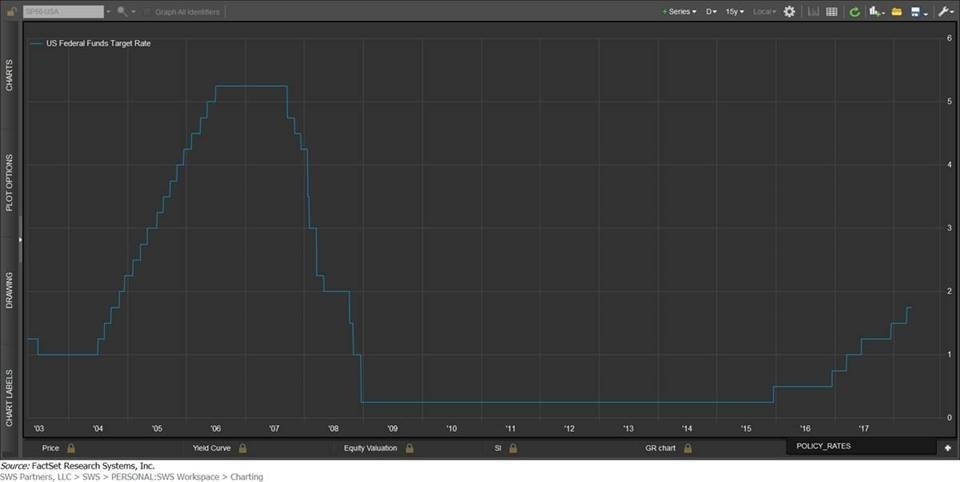
What’s unique about the current environment: The Fed had been dormant for seven years on touching the short-end (see chart below), having finally leaned into hikes at the end of 2015. Thus far in 2018, we’ve had one rate hike with three more expected later this year, and another 3-4 in 2019. The Fed’s Congressional mandate and reason for existence are 1) price stability and 2) maximum sustainable employment. So, the Fed takes anticipatory actions at the short end based on the same market dynamics that affect the long end. So, to conclude in isolation that short end hikes are going to cause flattening relative to the long-end relies on the false premise that economic activity will not cause the long-end to rise as well.
The direction of the short end is also an important consideration, as well as the definition of “flattening.” The article—referencing Macquarie, who is very reputable and has far greater resources than we do on macroeconomics and governmental yields—utilizes 10-2 year spreads, which are important but not fully descriptive of the entire “overnight rate to 30-year” spectrum, the complete definition of the yield curve. This is of importance when using the ‘08/’09 downturn comparatively. The chart below shows the setup heading into that period: The top green line as of 12/29/2006 shows the short end @4.71% increasing out to the 6M mark, then settling @4.81% for the 30-year. You can then see the reaction in the following three years (purple = 12/31/2007, yellow = 12/31/2008, gray = 12/31/2009; current = light blue). So, you can see at our current 1.75% Fed funds target rate, 1.65% 1-month yield, 2.01% 6-month, 2.19% 1-year, 2.43% 2-year, the short end is coming from a very different backdrop than ‘08/’09. Another important consideration for ‘08/’09 is that yield curve flattening started in mid-2005, after which the equity markets continued on a ~30% tear over the next 2.5 yrs, well before cracks ultimately appeared in late 2007. So, a flattening curve’s predictive power may, in fact, be strong, but it has very little assistance to lend on the timing factor (e.g., many hedge funds imploded on being “too soon” on the downturn call).

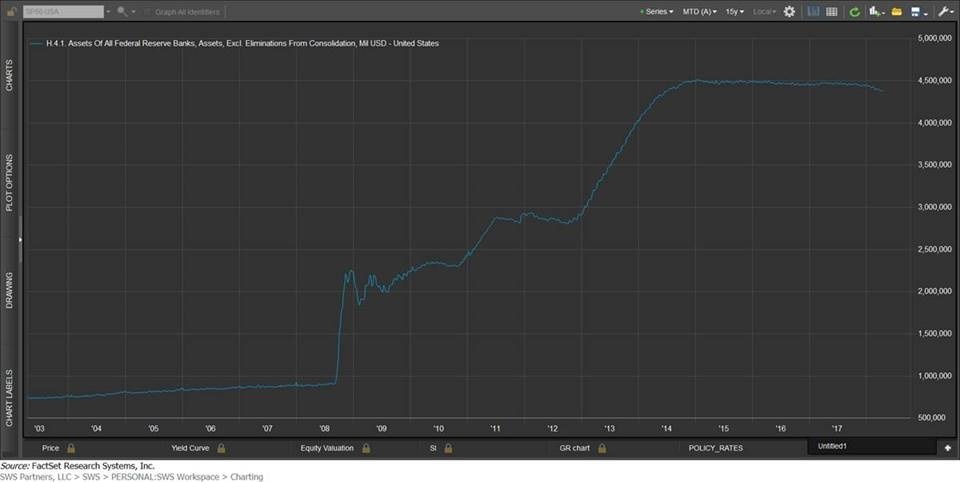
One never-before-seen dynamic in light of the current rising rate environment is the size of the Fed’s balance sheet: Currently $4.39 trillion as of today, a bloated level due to quantitative easing policies coming out of the ‘08/’09 downturn. In context, the Fed’s balance sheet sat at $900 billion in Sep 2008 (chart below). Since we lack precedent on orderly unwinding scenarios, it’s difficult to predict with any certainty what the impact will be other than to conclude that the Fed lacks an important tool in its arsenal, should a third derivative event like ‘08/’09 occur where our banks need the level of emergency capital they required. This is not a 0% probability by any means, something to keep an eye on, but unlikely to be an issue in the near term.
One disclaimer to all of this, we are equity portfolio managers who follow fixed-income trends as proxies and do not have to make explicit spread calls that could impact fixed income positions in our portfolios. That said, yield curve flattening is something to monitor closely. In isolation, it doesn’t have us concerned that we’re facing a recession in the next 12-24 months based on the above data points.