The following is an excerpt from our recently published Q3 Market Update. For a copy of the full document, please contact us.
Macro Backdrop
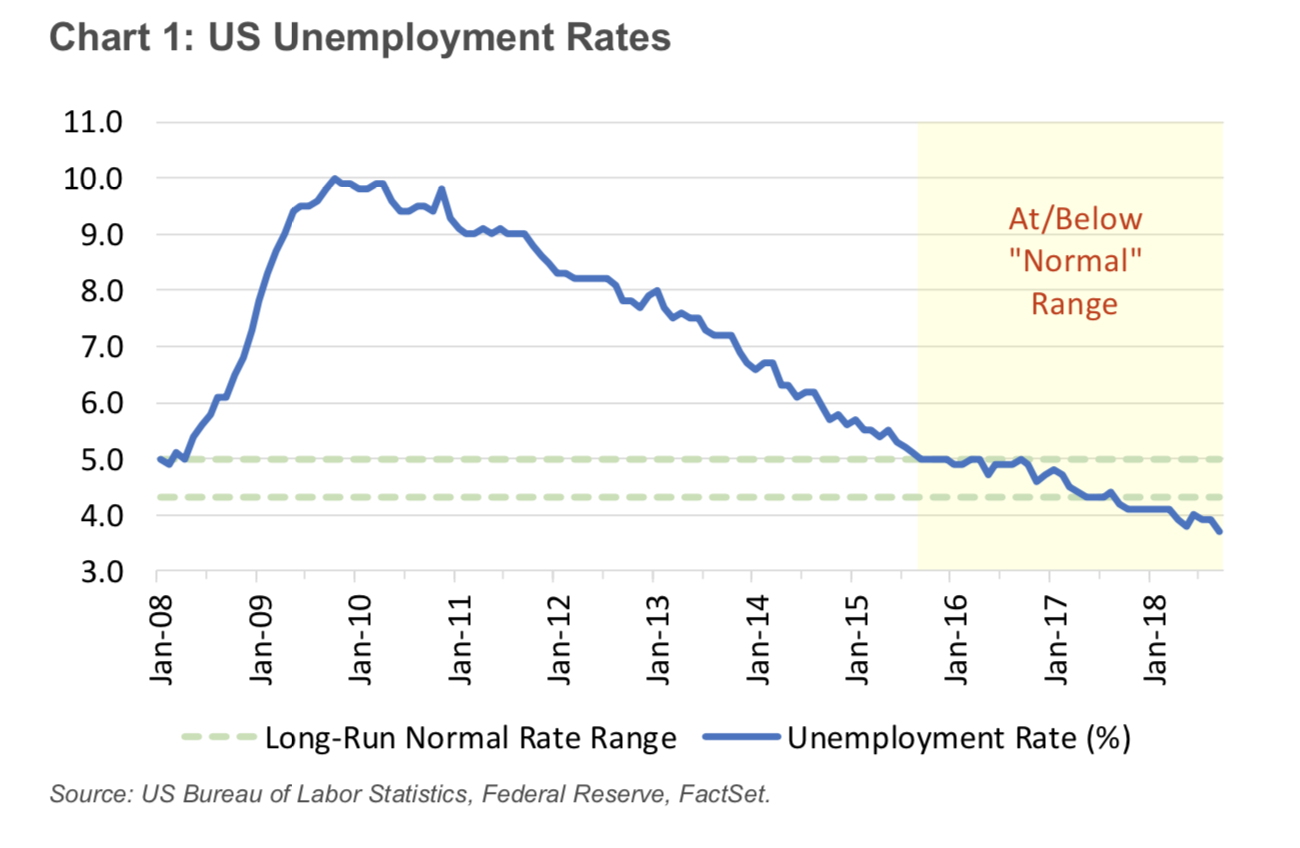
We began the year with many questioning whether the current expansion was becoming top-heavy, right at the time when tax cuts were transitioning from bill passage to implementation. Although there are still plenty of macro and geopolitical risks capable of creating cracks that later expand to fissures (looking squarely at you, tariffs), we see the economy on stable enough footing to support continued expansion. After delivering 14 quarters of lackluster growth, second quarter real GDP growth broke the 4% mark for the first time since September 2014. Consumer confidence levels suggest their assessment of current conditions remain extremely favorable, while robust job growth has continued to drive unemployment down to 3.7%. Granted, being this amount below the Fed’s definition of “normal” (see chart 1 below) brings into question labor scarcity, especially with tighter immigration controls that otherwise could alleviate lower- skilled segments.

Assessing the macro backdrop is a necessary exercise when studying which factors present headwinds or tailwinds to our underlying strategy positions. For example, balance sheet intensity considerations must take into account the shape and changes in the yield curve, outsized geographic exposures ought to consider trade relationship strains stemming from tariffs, and regulations that tighten or loosen for a specific sector merits impact assessment. As a strategy benched against a specific index, our exercise is very much one performed on a net exposure basis; our bet is that we ought to fare better relative to this proxy rather than attempt to circumvent large single-day market swings via large portfolio adjustments. That being said, we’ve had our fair share of big one-day drawdowns this year, with 19 single days of >1% drawdowns in the S&P 500 YTD versus just four seen across the entirety of 2017. This has occurred amidst a backdrop of volatility’s return, which largely had been dormant across the entirety of last year, as exhibited by the CBOE Market Volatility Index. However, in the context of volatility across the past decade, we’re still well below highs of the recent past.
To receive a copy of our entire SWS Growth Equity quarterly update, please contact us.