The following is another excerpt from our recently published Q4 Market Update. For a copy of the full document, please contact us.
The disclaimer of past performance not being indicative of future results is one plastered across every financial publication containing any hint of financial advice. And, although it’s an assumption that market technicians hold as truths, we find utility in observing the past in the exercise of context.
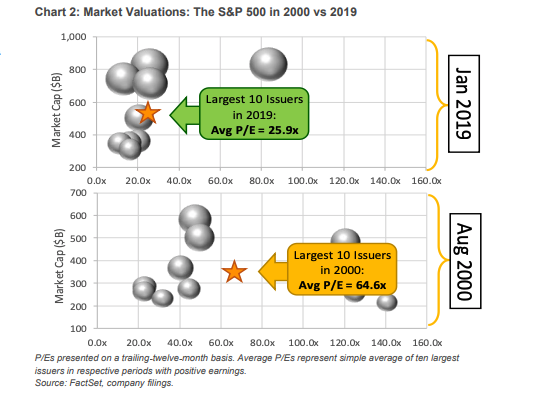
Take, for example, current concerns that we’re approaching a bubble burst, specifically one associated with lofty equity prices. Diving into the setup that created the “dot-com” boom/bust is a helpful comparative exercise to gain context on the pricing of the current environment. If you dissect the S&P 500 as of August 2000, a snapshot immediately prior to the two-year downturn that eroded 47% of market cap peak-to-trough, you would see significant bloat in trading multiples. This was especially pronounced among the large caps, as the ten largest issuers traded 64.6x earnings on average, while the overall market averaged 25.3x (see chart 2 below). Today’s top ten list averages 25.9x, a 60% discount to the Aug 2000 period, while the overall market trades 17.1x, 32% cheaper. We simply are not facing the same level of pervasive, nose-bleed valuations.
How companies were deploying technology at the turn of the century in comparison to today also translated into significantly different value propositions. As of August 2000, Time Warner was consummating its $160 billion acquisition of AOL, a business that represented the common means of US household internet access at the time. All that a company had to do was slap “.com” onto its corporate banner, and the market subsequently rewarded the move with instant multiple appreciation. Companies also had to face large Capex deployments in order to set up a distributed computing environment inside a company-owned data center. Today, we can convert what otherwise would have been multi-million dollar Capex outlays to variable-cost-based compute workloads, metered by the compute minute from the likes of Amazon AWS, Microsoft Azure, or Google Cloud Platform. In 2000, traditional fundamental valuations were also eschewed as antiquated, with greater emphasis being placed on pre-revenue type metrics, such as counting eyeballs and clicks. This all summed to a market topography that was becoming increasingly top-heavy at the end of the summer of 2000.
To receive a copy of our entire SWS Growth Equity quarterly update, please contact us.