The following is an excerpt from our recently published Q4 Dynamic Growth Opportunities (DGO) update. For a copy of the full document, please contact us.
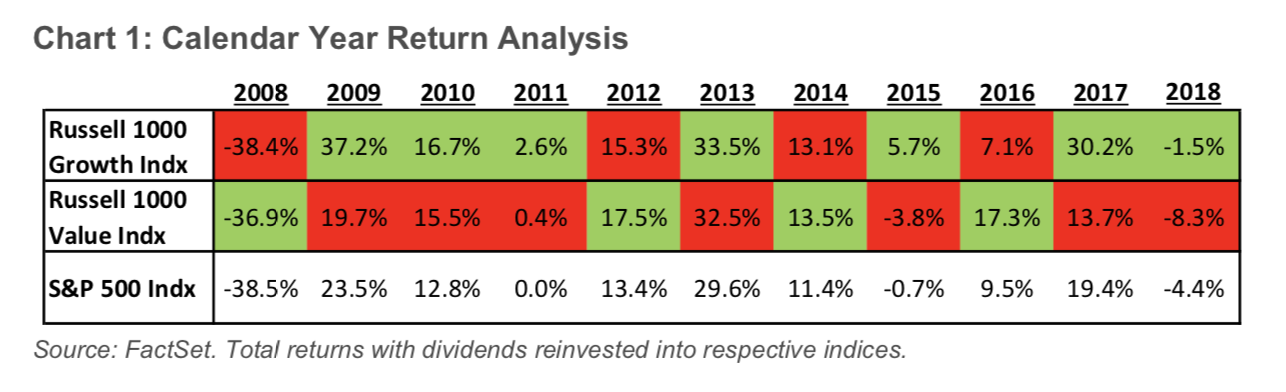
The start of a new year makes for an opportune time to reflect, and with the understanding the equity markets in 2018 can be anxiety invoking for an equity investor. This update will address market volatility head-on, namely in our macro backdrop analysis. We see 4Q2018 as a period where price temporarily deviated from value, where inherently less liquid periods saw increased panic selling, and where a peak-to-trough drawdown of 20% delivered a correction many feared was imminent. Although we experienced a couple periods during the quarter where catching favorable bids seemed akin to catching a falling knife, we saw a growth vs. value year-end snapshot that mimicked the outcome of six out of the prior ten years. Despite finishing -1.5% lower across CY2018, growth held up better in total- return terms than its value counterpart, the latter of which netted -8.3% over the same period (see chart 1 below). We see the bottom-up drivers to this as remaining intact, a topic we’ve explored in prior white papers (here, here, and here). With technology growing increasingly pervasive across every market sector, rewarding its enablers with increased efficiency across various Opex and COGS line items, we find it increasingly critical to understand value creation with a lens calibrated for technological disruptions.
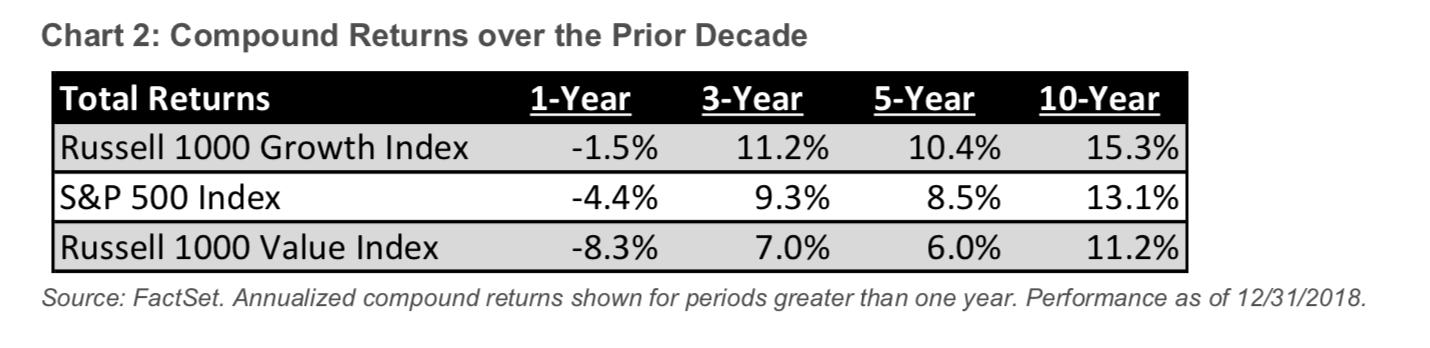
Aggregating the individual calendar years into compound annualized terms, one may observe return disparity between the two equity investing styles (chart 2). Although the delta may very well narrow going forward, we believe it is prudent for most long-term oriented investors to retain exposure to the “growth” equity asset class.
Raison D’être: Alpha Delivery
In terms of the 53 positions held in our strategy, only four netted a positive return during the fourth calendar quarter. On a relative basis, 26 fared better than our index, as market volatility proved difficult to circumvent for any long-term focused investor. Below we dive deeper into issuer-specific drivers that aggregated to these portfolio results, looking at the top three contributors and detractors to DGO performance during 4Q2018 (each listed with price reaction for the period).
Contributors:
CME Group Inc. Class A [CME]: +12.0%: Overall, the financial services sector skews to the smaller exposures for our index, sector-wise…
To receive a copy of our entire SWS Growth Equity quarterly update, please contact us.