The following is another excerpt of the latest installment of From the Desk of the CIO, titled Volatility in Context. In it, we detail our belief in the ability to generate relative value irrespective of turbulence in the equity markets. Compared to the theatrics that you might be seeing on television or in the news, we think this is a sober perspective that will keep things in context.
You can download a copy of our research by clicking here.
We see recent market price swings as signs of it wrestling with two primary factors:
-
Central bank policies pertaining to interest rates, and
-
Tariff escalations.
We unpack both in the context of the price reaction we’re seeing.
Market Reaction
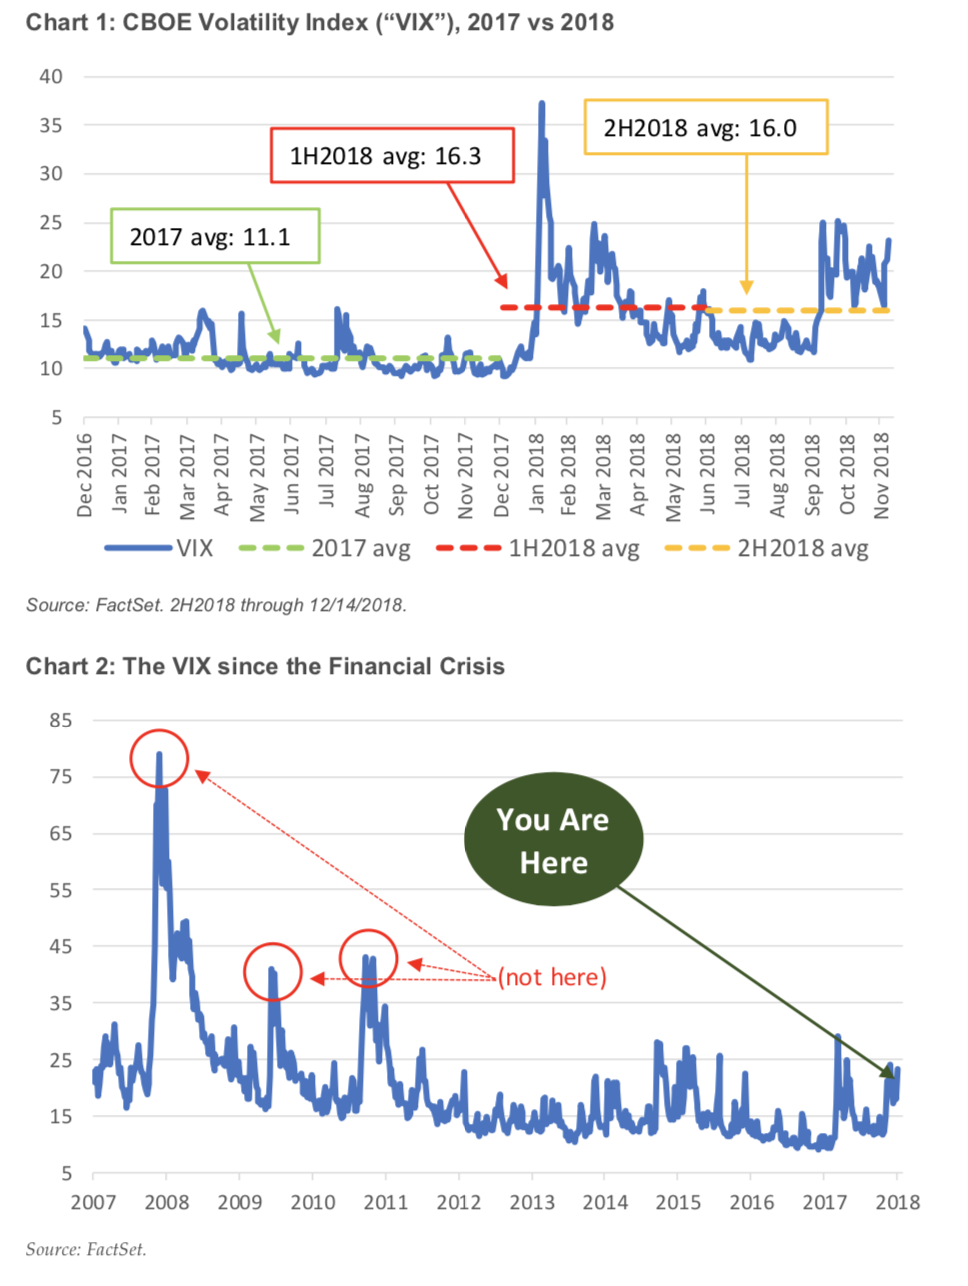
Enduring a 10% peak-to-trough drawdown in the fourth quarter makes for an unsettling way to close out the year. As queasy as the short term fluctuations are, it’s important to keep the volatility in context. Quite simply, 2017 was an incredibly muted year, volatility wise. This, in turn, causes the spike we saw this past January to stand out as an outlier relative to all of last year and makes its recent re-emergence since October unnerving (see chart 1). However, looking back across the prior volatility environment since the financial crisis, specifically via the CBOE Market Volatility Index (“VIX”), we find ourselves well below high-water marks of the calendar years 2008 through 2012 (see chart 2).
Slicing it another way, we’ve thus far seen 15 trading days where the market has closed down more than 2% (a figure that stood at 13 as of our report’s Dec. 19 publication), versus none across the entirety of 2017. And while the number of such declines in 2018 is also higher than those seen in 2015 or 2016, we are a far cry from the 41 and 28 we saw in 2008 and 2009, respectively.
Download the rest of our research by clicking here or the image below.