Periods of dislocation like we are currently experiencing can try the patience of investors— especially American investors who are brought up from birth to believe we can affect the market by our actions—because we feel like we should be doing something. It’s the American way, as Neal McDonough says in that now-infamous Cadillac commercial: “You work hard, you create your own luck, and you gotta believe anything is possible!”
So where does that leave us during this current downturn? For those of you who are veterans of our blogs and market analyses, you know that SWS Partners leans heavily on cogent fundamental analysis and a dispassionate view of portfolio management. We are paid to be out in front of the market, so we have spent the last few days pouring over the precedent for the current market so that we can provide some insight into where we go from here.

If you look at the past seven recessions and 1) take note of how long into each given recession it took the S&P 500 to bottom, and 2) measure the % drawdown to that bottom (starting point = last day of expansion immediately preceding given recession), you find the following results:
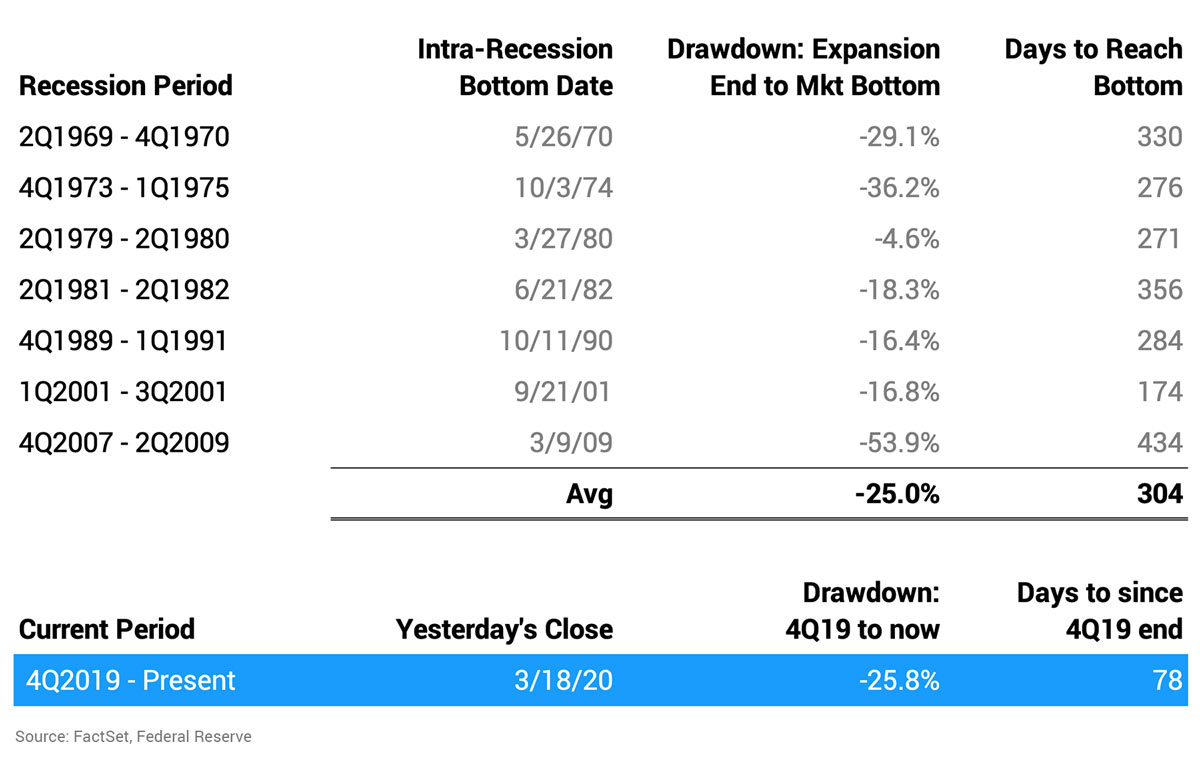
On average, the market drops 25% from the end of the prior expansion period to the market bottom during the recession. Compare this to where we are today: if you assume the first quarter of 2020 is the start of recession, we are down 26% from the end of the last expansion (12/31/2019). Our arrival there occurred in one-quarter of the time it took in the last seven recessions (78 days vs 304 days). That’s fast. Really fast.
It’s natural to eye the 53.9% drawdown of the 2008-09 financial crisis and suggest that’s the true floor and, therefore, we’re only 48% of the way there, 25.8%/53.9%. While the COVID-19 shock is unprecedented in terms of the speed of its modern economic impact—if not in terms of an actual flu pandemic—it does not present facts and circumstances that support comparison to 2008-09. Instead of millions of scenarios attempting to answer the “how long” question that the 2008-09 financial crisis entailed, and the trillions of dollars of global capital necessary to combat it, here we’re dealing with a much more finite and definable risk.
Primarily, suppressing and/or mitigating the spread of a virus during a window in which we increase our ability to detect the infection through an increased quantity of testing kits and the aggressive ramp-up of vaccine development suggest a vaccine is only 12 to 18 months out. Rarely do you head into an economic pull-back with that level of end-point visibility. Therefore, we believe this supports our thesis that the shape of the recovery curve could mimic the downdraft’s shape. Unfortunately, we don’t have perfect visibility of when that will take place in the vaccine’s 12-18 month development window. While the WHO is reporting encouraging signs of new daily cases declining in China and South Korea, there is still a significant amount of execution risk involved in enticing a global population to distance/shelter as needed, as well as ensuring hospital ICUs have necessary capacity and equipment.
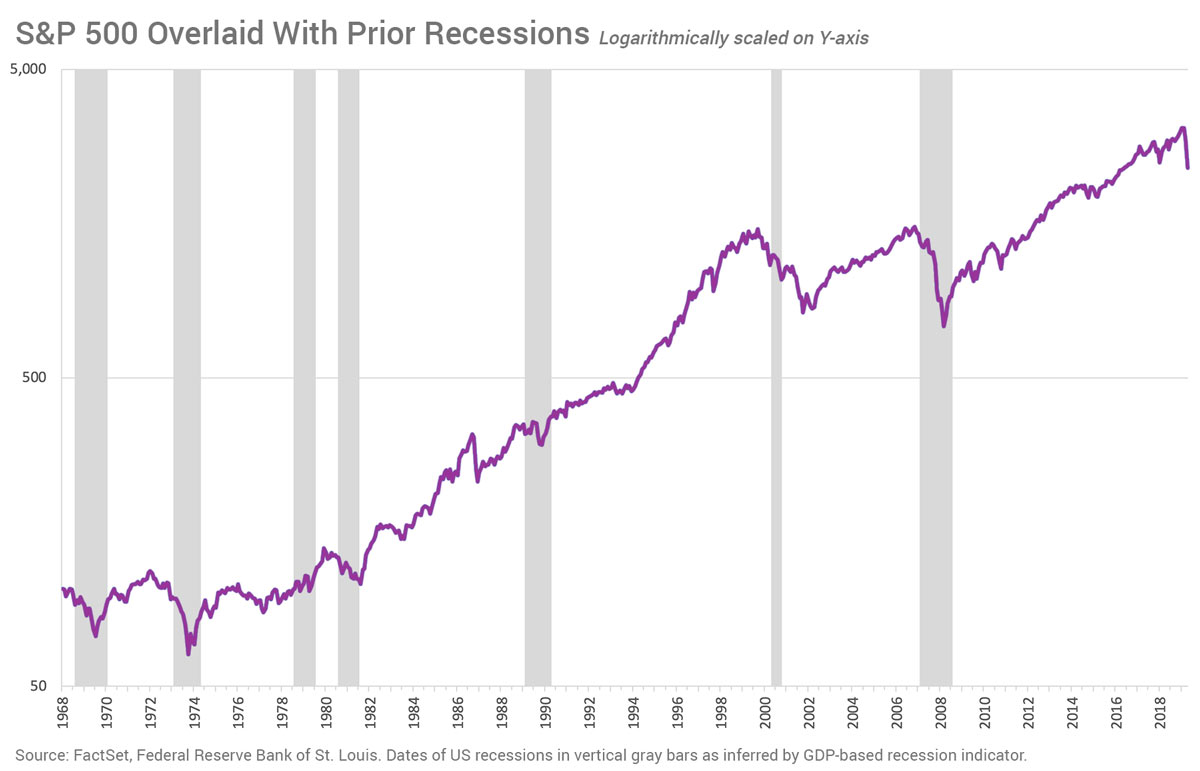
Visually, here’s how we fared across the seven prior recessions (hint: economic expansion eventually ensues and civilization marches onward):
In terms of market P/E multiple, we’ve already experienced a 28% peak-to-trough erosion in P/E multiple, ending March 18th at 13.9x forward earnings. Looking back as far as we have FactSet data on forward S&P earnings projections, we see the market assigning a range of 15.2x-18.7x forward P/E multiples to a “normally” functioning economy. Determining appropriate multiples is part art, part science, but we currently trade at a 16% discount to the mean level of these prior expansionary periods:
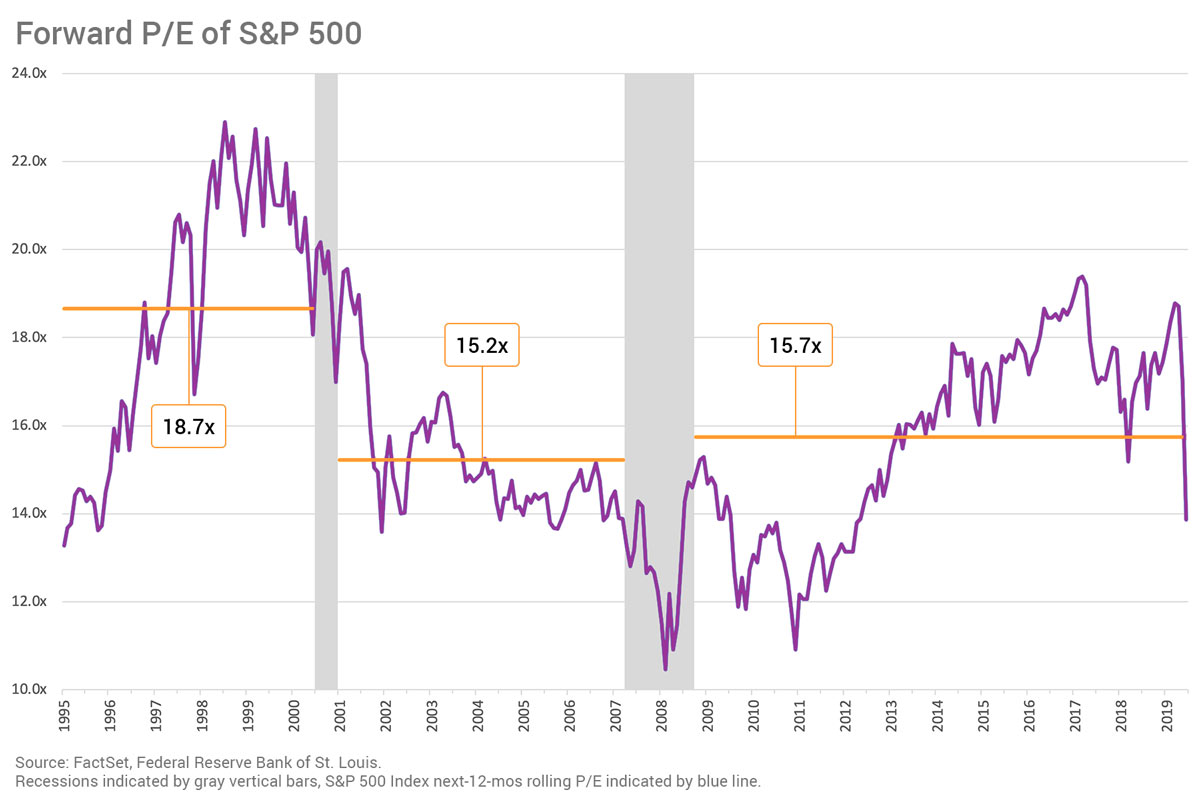
Our piece last week covered the heaven and earth that had to be moved to right-size the global economic ship in ‘08/’09. Unlike now, during that time the entire financial services sector was taking massive losses and contributing negative earnings to the overall S&P 500 results. Since multiples correct faster than it takes financial results to hit quarterly earnings results, one could argue the 2008 bottoms were reflecting artificially low P/Es because the “E” took longer to adjust. Given the 16% discount that we sit at today relative to the prior three expansionary periods in Chart 2, one could argue that much of the bad news has been baked into the multiple. As a proxy to the market’s pricing of future earnings, the multiple’s inverse (“E/P”) can also illustrate the future earnings yield to overall equities. In this case, the S&P 500 currently offers a 7.2% earnings yield to the unlevered investor, relative to 5.2% it yielded in mid-February. As global investors with fungible capital search for the best use of that capital, this highly-liquid asset class continues to look more and more attractive.
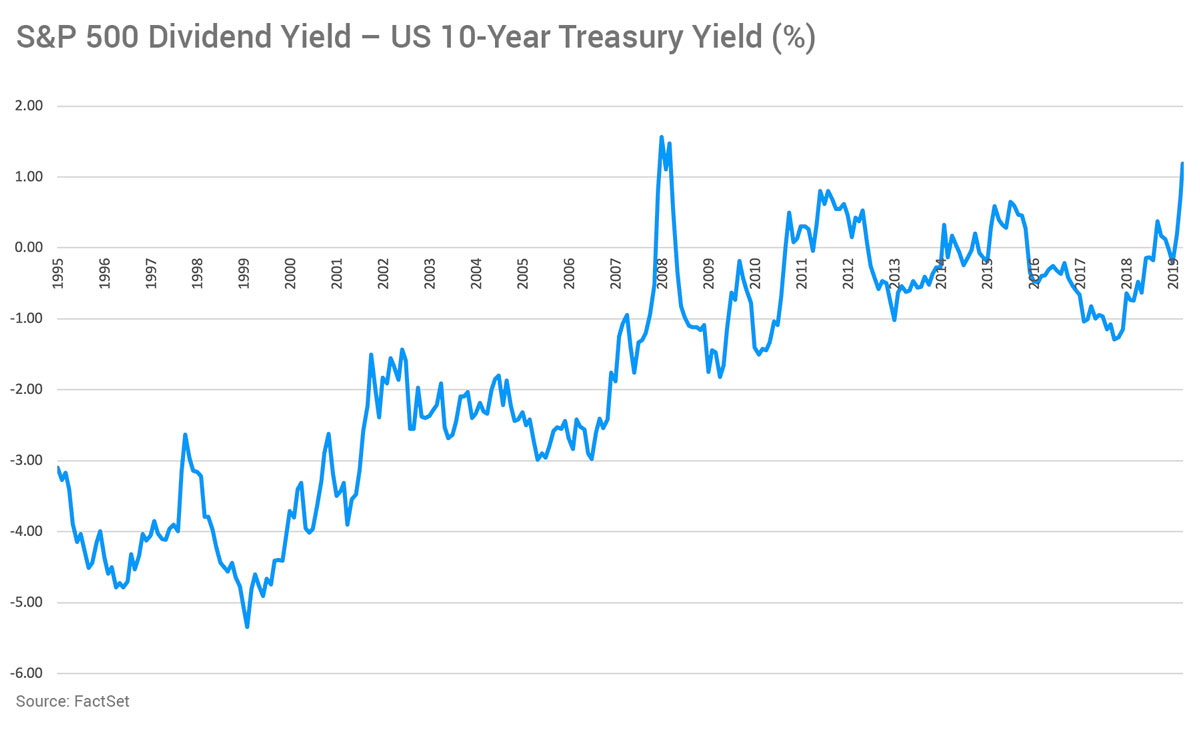
Lastly, we aren’t under the illusion that dividends will not be revisited by boards eyeing reductions in operating cash flow. However, since dividend yield is often viewed in relative terms to the entire global yield opportunity, it’s notable that we’re sitting near the widest spread of S&P 500 dividend yield-to-10-Year US Treasury in recent history. We are 20 basis points (0.20%) away from the December 2008 high, in terms of S&P dividends besting the 10-Year:
One could argue that whenever the dust settles, this relative backdrop of both dividend and earnings yields could make equities more attractive than other global asset classes. Additionally, with oil hitting mid-$20s, yield-seeking capital that otherwise would be deployed towards energy investments might also look elsewhere and find broad dividend-paying equities more attractive.
Regarding market bottoms, to go meaningfully below where we are now (13.9x forward earnings) would require systemic damage to our banks. Unlike ‘08/’09, when the forward multiple hit 10.6x, banks are well-capitalized, and the Federal Reserve is back-stopping lending. Commercial lending and refinancing are also increasing due to low interest rates. Therefore, if we presume that there won’t be a systemic shock to the system due to bank over-leverage, we are currently at a normal recession-like forward multiple.
This market is currently driven by panic created by an unknown: the impact of Covid-19. When we eventually have clarity on the impact of the virus in the US, the market will once again focus on earnings. Add to that a level of global liquidity that is unprecedented outside of ‘08/’09 and we have a market set to recover at a record pace. That said, we appreciate that this period of uncertainty is driving investor anxiety unabated, so if you have questions or concerns about the market or your portfolio, give us a call.